In June 2011 I was invited to participate in a hackathon by Europeana, an EU initiative focussed on opening up the digital archives of Europe’s museums, libraries, and archives to the public.
Among the tools they offer is an API that searches in all of these databases and returns results in a uniform way. So instead of having to query each of these sources individually, you can search them all in one go.
We had a few hours of time to experiment with the API and to come up with an interesting application. Here is what I worked on:
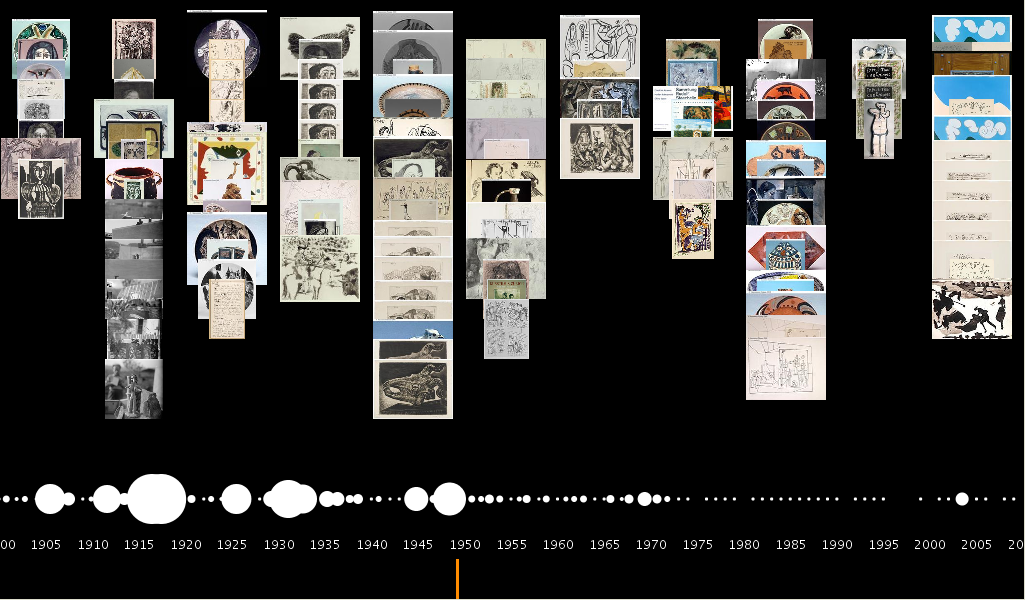
Visual Chronology – that’s what I called it – is a sketch displaying Europeana search results on a timeline. At the bottom of the screen, years are represented by dots. The larger a dot, the more results were found for that year. This info graphic doubles as navigation for jumping or scrolling through time. The tool could be applied in an exhibition context, for example with a touch screen interface.
This project received a prize in the ‘innovation’ category. Here is some coverage on the hackathon by the Picasso Museum in Barcelona, where the event tool place.
Tools used
Processing, Europeana API.
